Columns Review: The Ultimate Guide to AI-Driven Data Storytelling
In today’s data-driven world, it’s not enough to simply collect and analyze data. What truly matters is how you present and share that data to tell a compelling story. This is where Columns comes into play. If you're tired of complex BI tools like Tableau and crave a more engaging, intuitive way to transform your data into meaningful narratives, Columns might be exactly what you need.
As an AI-powered data storytelling tool, Columns allows you to take your raw data and turn it into a visually stunning and insightful narrative. Whether you're a consultant, educator, or marketer, Columns offers an easy-to-use platform to work with data from a variety of sources. With AI assistance and customizable design tools, this tool helps you create professional-quality presentations without needing advanced design skills. If you're wondering whether Columns could replace traditional tools like Excel or Google Sheets, this review will dive into the features that set it apart.

Let’s explore how Columns works, its unique features, and how it can streamline your data storytelling. Whether you're using structured data from sources like Google Sheets, CSV files, or APIs, Columns allows you to visualize, analyze, and share data with ease.
What is Columns?
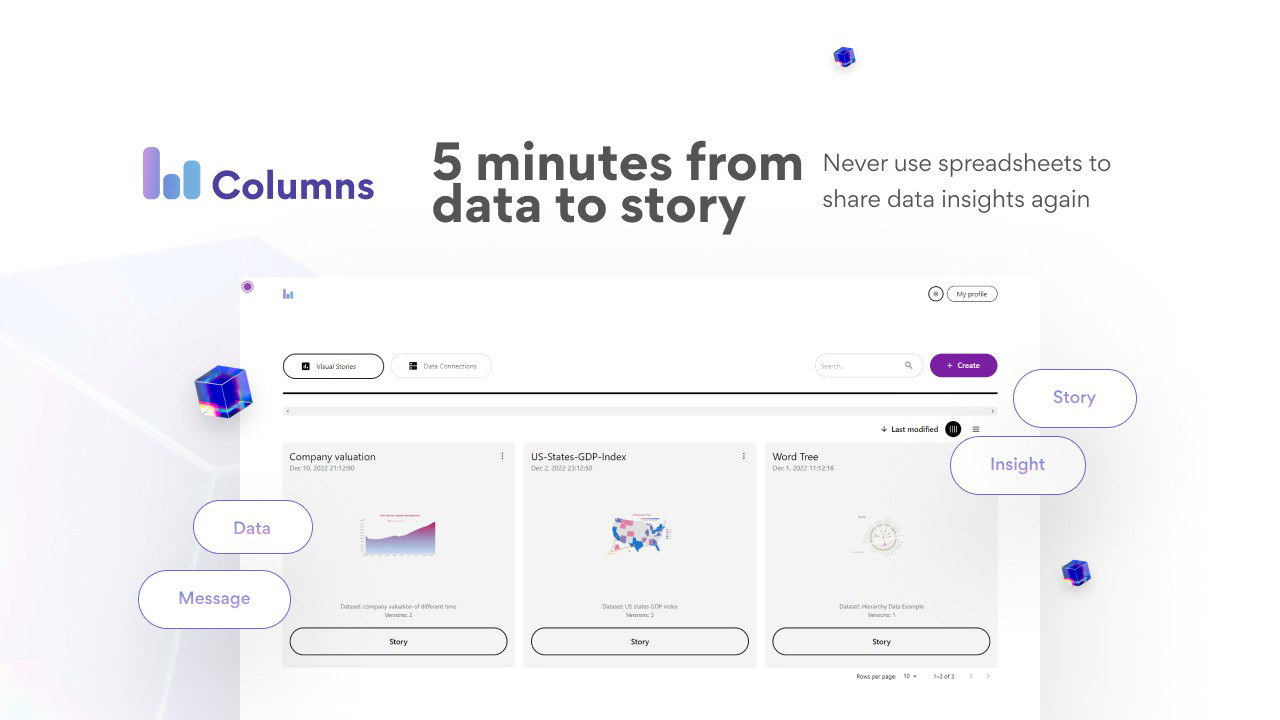
Columns is an AI-powered platform designed to help you tell data stories more effectively. Unlike traditional business intelligence tools like Tableau or Power BI, Columns focuses on transforming your data into narratives that are both visually appealing and easy to understand. With Columns, data isn’t just about numbers—it's about making those numbers meaningful through engaging storytelling.
This platform makes it possible to connect multiple data sources, from Google Sheets and Notion to SQL databases and CSV files, and then leverage AI to analyze and visualize the data in a way that highlights the key insights. Whether you're building a dashboard, crafting a report, or sharing a data-driven story, Columns provides a suite of tools to help you communicate your findings clearly and effectively.
Key Features of Columns
1. AI-Powered Data Storytelling
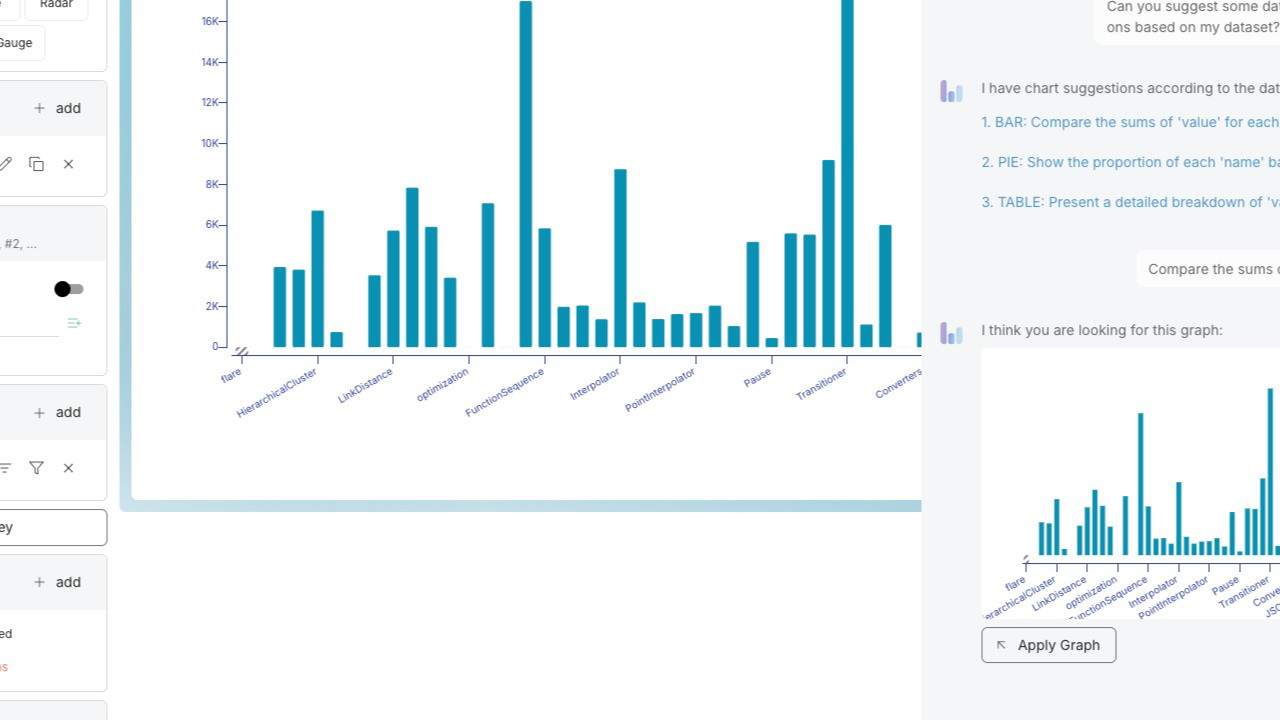
One of the standout features of Columns is its AI-driven storytelling capabilities. Instead of manually creating charts and graphs, you can simply chat with the AI to extract insights from your data. The AI analyzes your data and automatically generates the most relevant visualizations and narratives. This feature is especially helpful for users who aren’t design experts or don’t have the time to create complex charts from scratch.
-
Easy Insights Extraction: You can easily query the AI to identify trends, correlations, or outliers in your data, and the AI will turn these insights into actionable visualizations.
-
Data Exploration: Whether you want to filter, sort, or analyze data, you can interact with the AI to get the insights you need quickly.
2. Customizable Visual Presentations
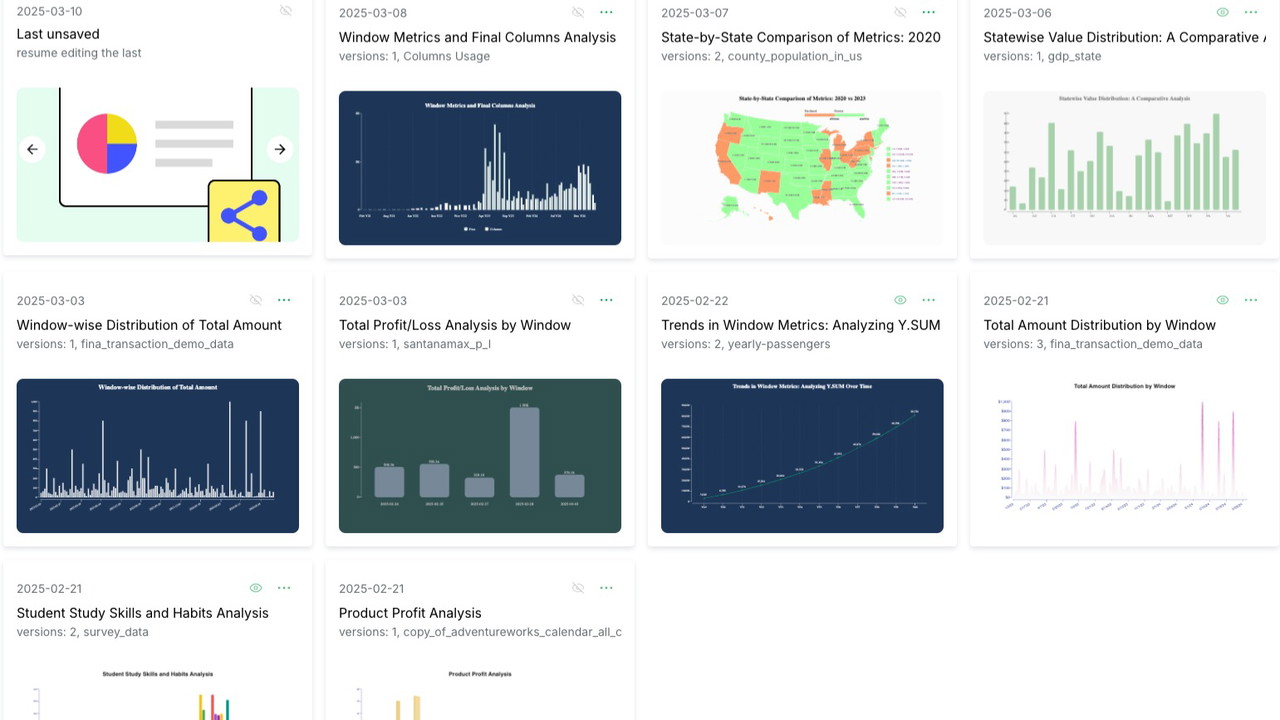
With Columns, you’re not just limited to standard charts and graphs. The platform allows you to design your data presentation with full control over its visual elements. From color schemes to layout adjustments, Columns provides a flexible design environment that ensures your data tells the story you want to convey.
-
Design Flexibility: Customize each element on the canvas, from the type of chart to the colors and labels. This flexibility makes it easy to match the design to your company’s branding or personal preferences.
-
AI Assistance: If you’re unsure about how to style your visuals, the AI can suggest themes or even automatically style your data based on best practices.
3. Real-Time Data Updates
One of the most impressive aspects of Columns is its ability to keep your stories up-to-date with real-time data updates. Once you've connected your data sources, you can set automatic update schedules so that your story remains current without you having to manually adjust it every time your data changes.
-
Automatic Syncing: Set a schedule, and Columns will keep your story synchronized with the connected data sources. This is particularly useful for dashboards or reports that need to reflect the most current information.
Sponsored
-
Effortless Maintenance: You won’t need to worry about manually updating your data visualizations. Columns takes care of this for you, ensuring that your audience always has access to the latest insights.
4. Flexible Sharing Options
Once your data story is complete, you can easily share it with others. Columns provides several ways to share your creations, whether it’s with a team, clients, or a broader audience.
-
Public Links: You can generate a viewable link that allows anyone with access to see your data story. This is great for sharing insights with non-technical stakeholders who may not have access to your platform.
-
Embedding: If you have a website or blog, you can embed your visualizations directly into your pages. This ensures that your data story reaches your audience without needing them to leave your site.
Sponsored
5. Support for Multiple Data Sources
Columns supports a variety of data sources, making it easy to integrate with the tools you're already using. Whether you’re working with Google Sheets, Notion, Airtable, or even more complex systems like SQL databases or REST APIs, Columns allows you to pull in your data seamlessly.
-
Data Connectivity: The platform integrates with many popular tools and databases, meaning you don’t have to worry about data import issues or compatibility problems.
-
Structured Data: Columns works with structured data in formats like CSV, TSV, and more, making it easy to upload your data into the platform and start storytelling immediately.
Why Choose Columns?
1. Simplified Data Analysis
Columns takes the complexity out of data analysis by using AI to automatically suggest and create the most meaningful visualizations. Whether you're a marketer tracking campaign performance or a consultant analyzing business metrics, Columns simplifies the process, allowing you to focus on the insights rather than the technical details of data visualization.
2. AI-Enhanced Storytelling
With Columns, you don’t need to be a data scientist to present your findings. The AI assists with every step, from data exploration to creating the final narrative. This makes it an ideal tool for educators who want to present data in an engaging way or for businesses looking to communicate their metrics to clients.
3. Collaboration and Sharing Made Easy
Columns makes it easy to share your work with others. Whether you need to collaborate with team members, present to clients, or share insights on your website, the platform offers several flexible options to get your data story in front of the right people.
Conclusion
In a world where data is constantly growing and evolving, the ability to present it clearly and compellingly is more important than ever. Columns offers an intuitive, AI-powered platform that makes data storytelling easier, more efficient, and more visually appealing than ever before. Whether you’re working with Google Sheets, CSV files, or SQL databases, Columns allows you to transform your raw data into stunning, insightful narratives that captivate your audience and drive better decision-making.
If you’re looking for a tool that combines the power of AI, customization, and real-time updates to turn your data into actionable stories, Columns is the perfect solution. Start transforming your data today with Columns and make your insights work for you.